
Final Project: Working with the New York Airbnb Pricing Report in Tableau Public
Estimated time needed: 60 minutes
Required software:
You can complete this project using the free Tableau Public online platform or the Tableau Desktop (Public Edition) app.
About the data set:
Since 2008, guests and hosts have used Airbnb to expand on traveling possibilities and present a more unique, personalized way of experiencing the world. This data set describes the listing activity and metrics in New York city for 2019. This data file includes all the needed information to find out more about hosts, geographical availability, and necessary metrics to make predictions and draw conclusions. This public data set is part of Airbnb.
This public data set is available on the Kaggle website as New York City Airbnb Open Data under the CC0: Public Domain license. The primary data set was retrieved from the website.
Hold the CTRL key while you click to download the following file:
Attributes of this data set have been explained below:
| Column | Type | Description |
|---|---|---|
| id | Number | Unique identifier for each Airbnb listing. |
| host_id | Number | Unique identifier for the host of the listing. |
| price | Number | Price of the listing per night. |
| minimum_nights | Number | Minimum number of nights required for a reservation. |
| number_of_reviews | Number | Total number of reviews received by the listing. |
| reviews_per_month | Number | Average number of reviews received by the listing per month. |
| calculated_host_listing_count | Number | Total number of listings hosted by the same host. |
| availability_365 | Number | Number of days out of the year the listing is available for booking. |
| latitude | Number | Geographic coordinates of the listing's location. |
| longitude | Number | Geographic coordinates of the listing's location. |
| Name | String | Name of the listing |
| host_name | String | Name of the host |
| neighbourhood_group | String | The broader area surrounding the listing (e.g., Brooklyn, Manhattan). |
| neighbourhood | String | A specific neighborhood within the city (e.g., Williamsburg, SoHo). |
| room_type | String | Type of accommodation offered (e.g., Entire Place, Private Room, Shared Room). |
| last_review | String | Date of the most recent review received by the listing. |
Task descriptions for the project
Task 1. Building hierarchies
1.1 Create a hierarchy named Neighbourhood Hierarchy using Neighbourhood and Neighbourhood Group.
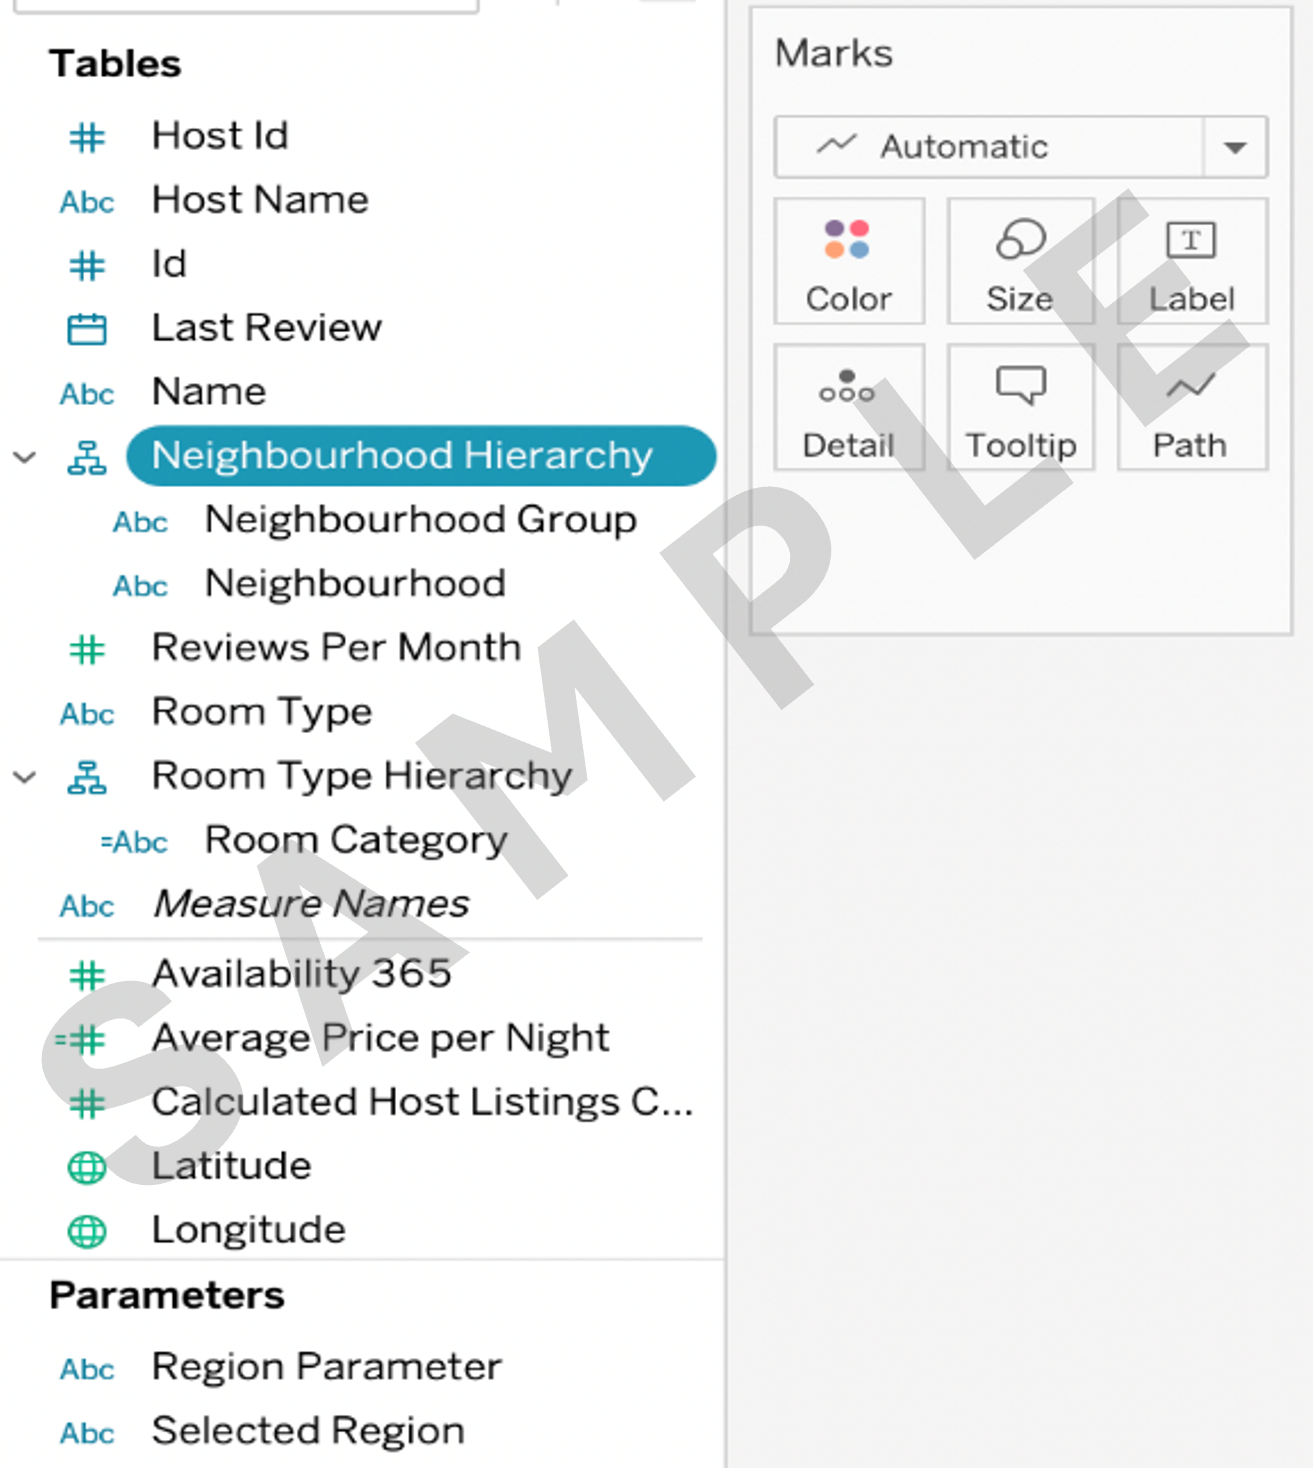
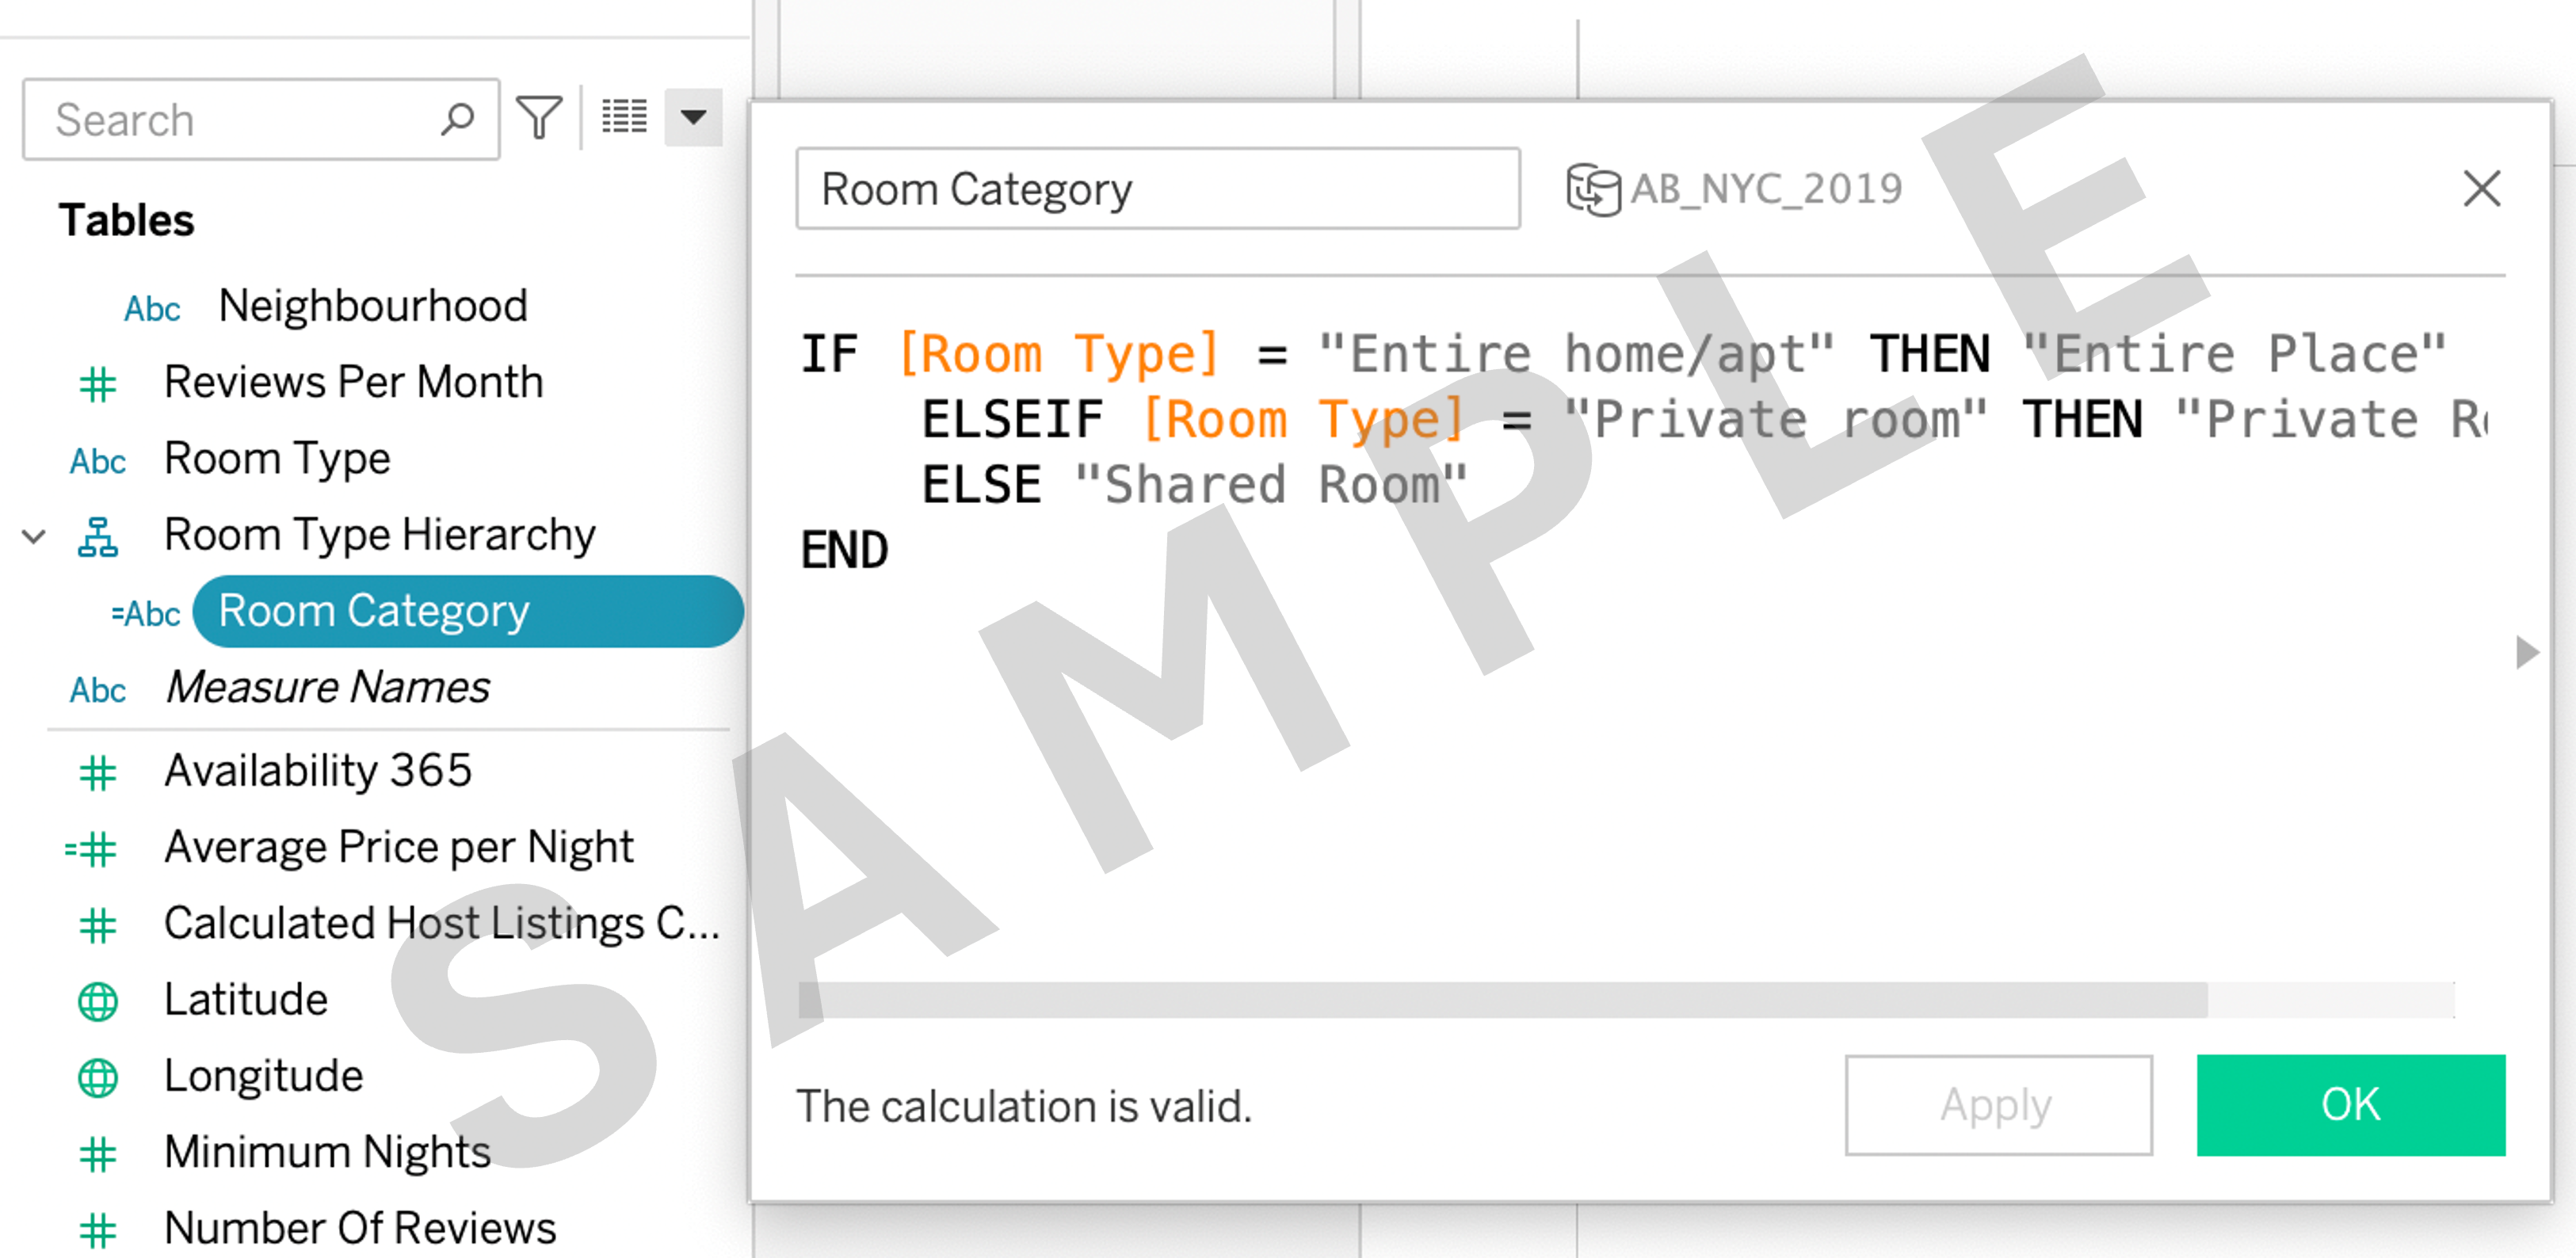
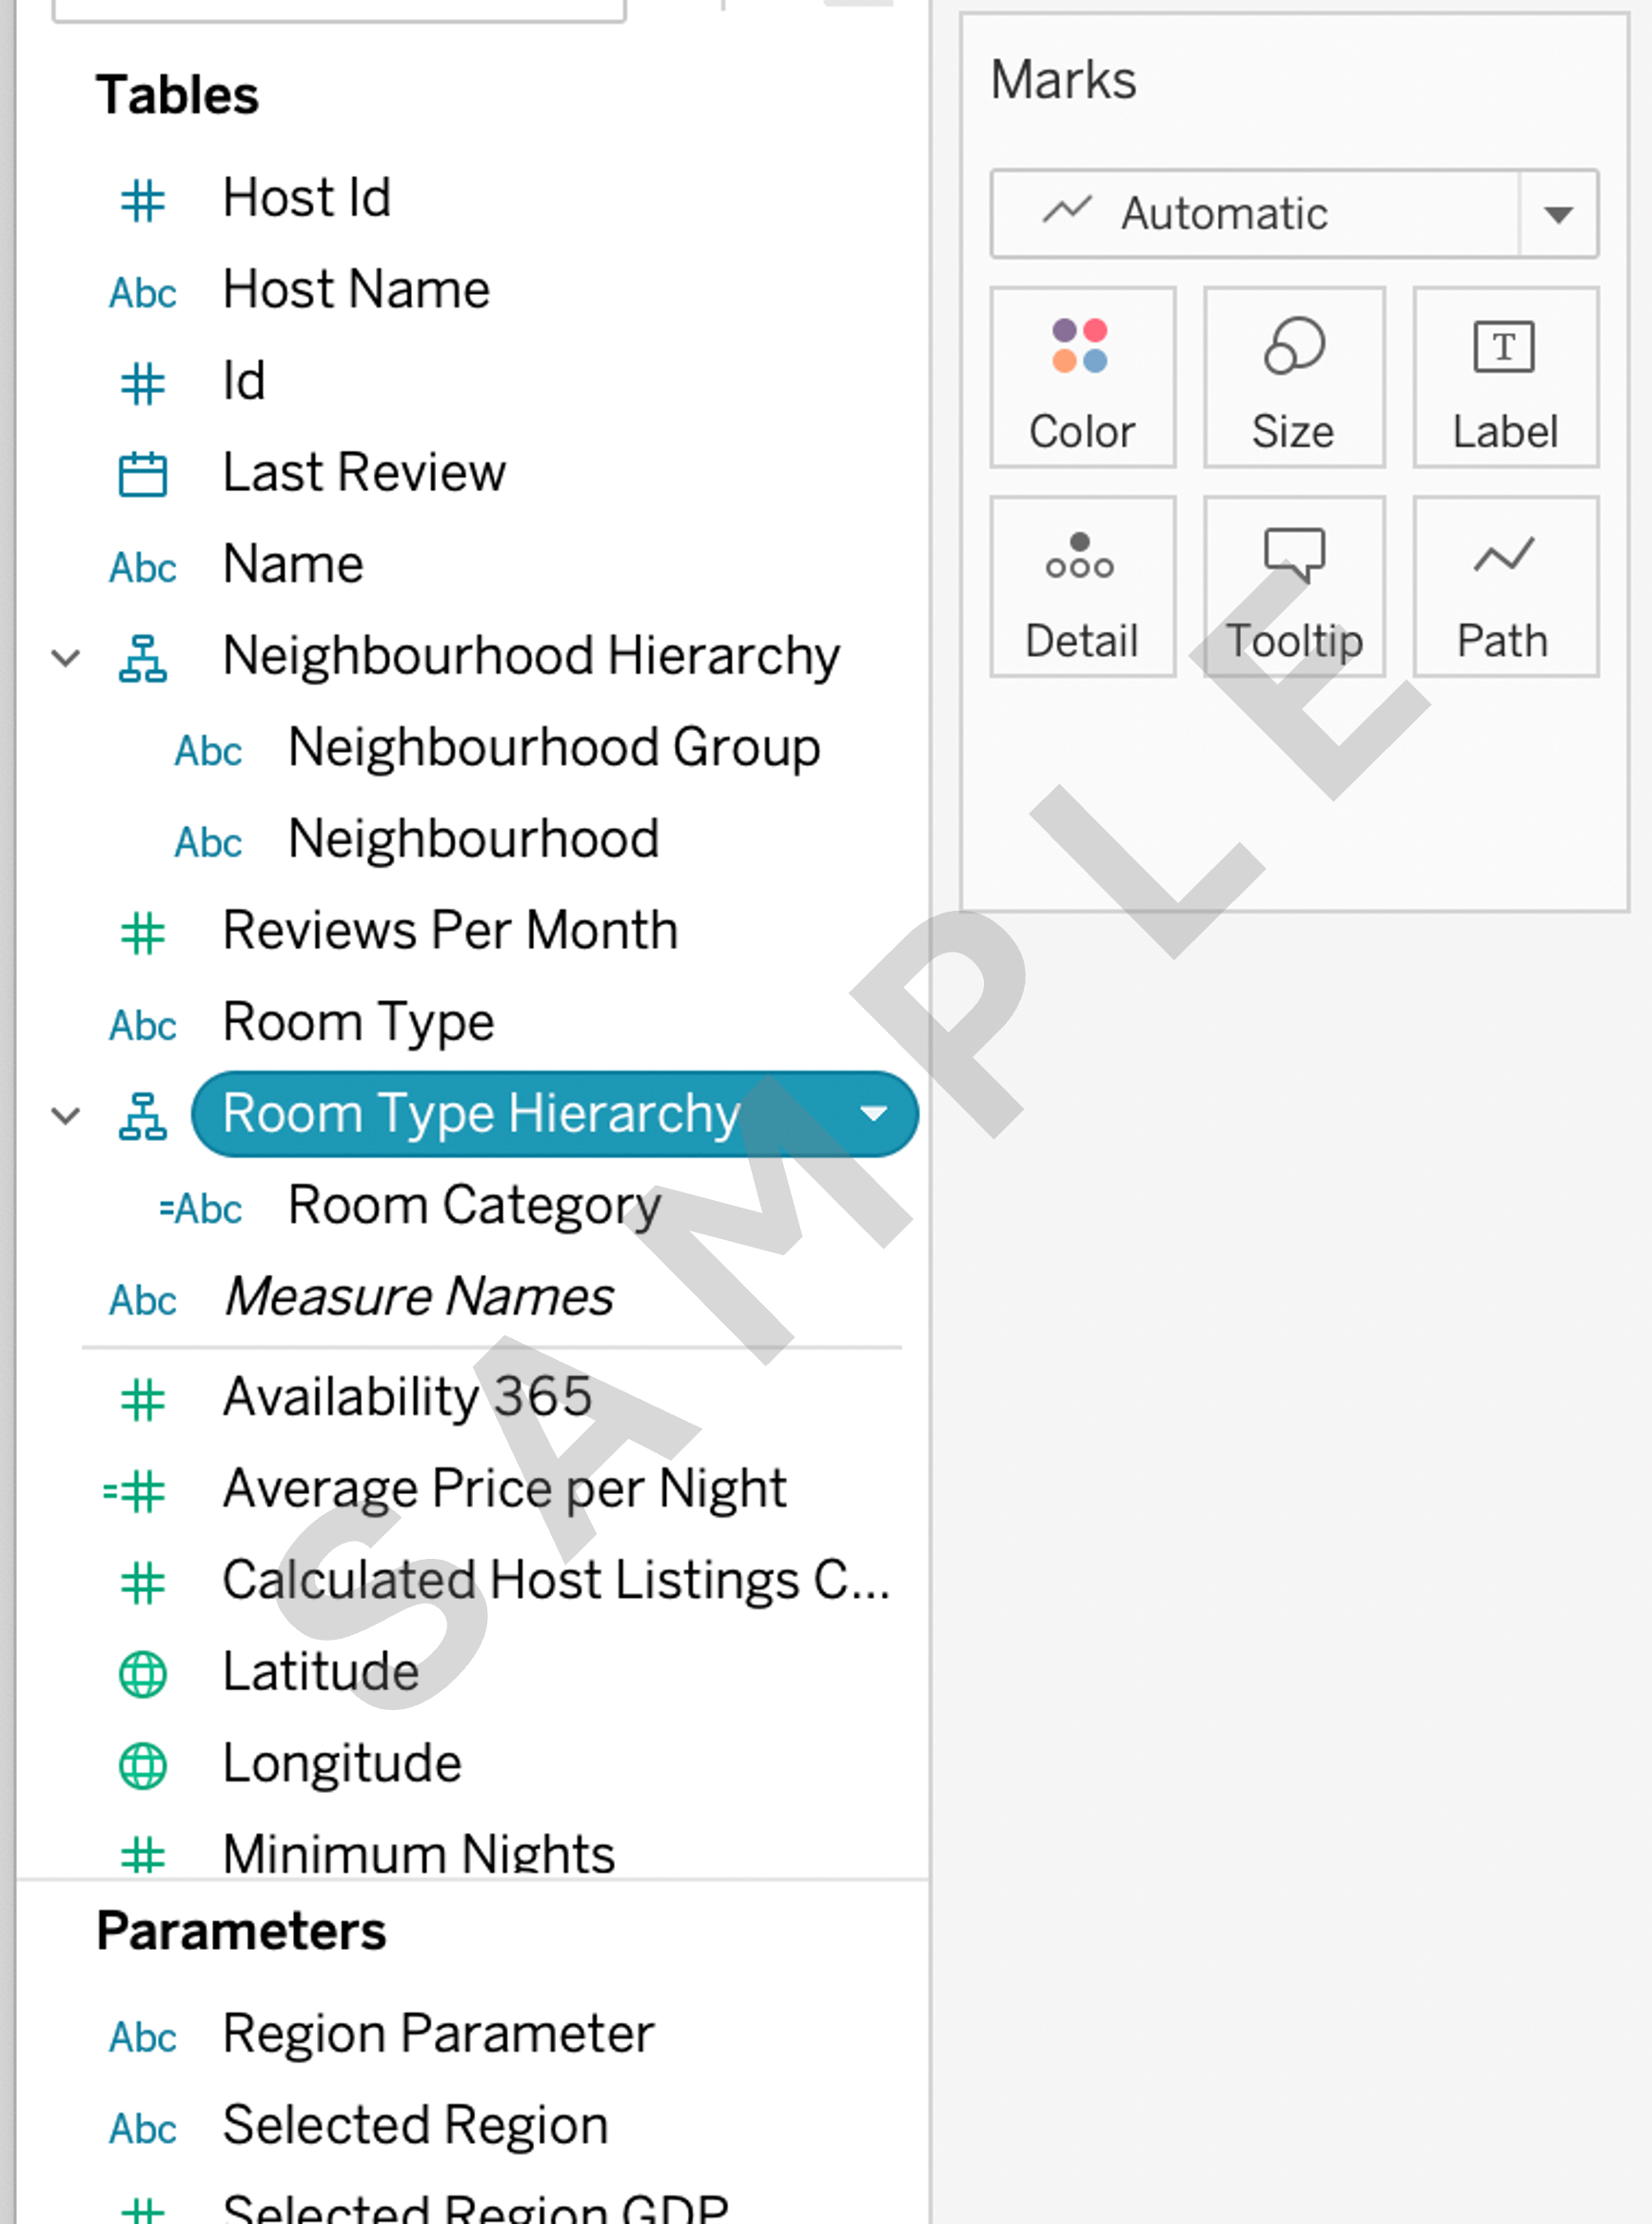
1.2 Create a separate hierarchy named Room Type Hierarchy for different room type entire home/apt, private room and shared room. There is no separate field like Entire home/apt, Private room or Shared room.
First, create a calculated field Room Category using the If-then-else command and then include that in Room Type Hierarchy.
Task 2. Simple data modeling
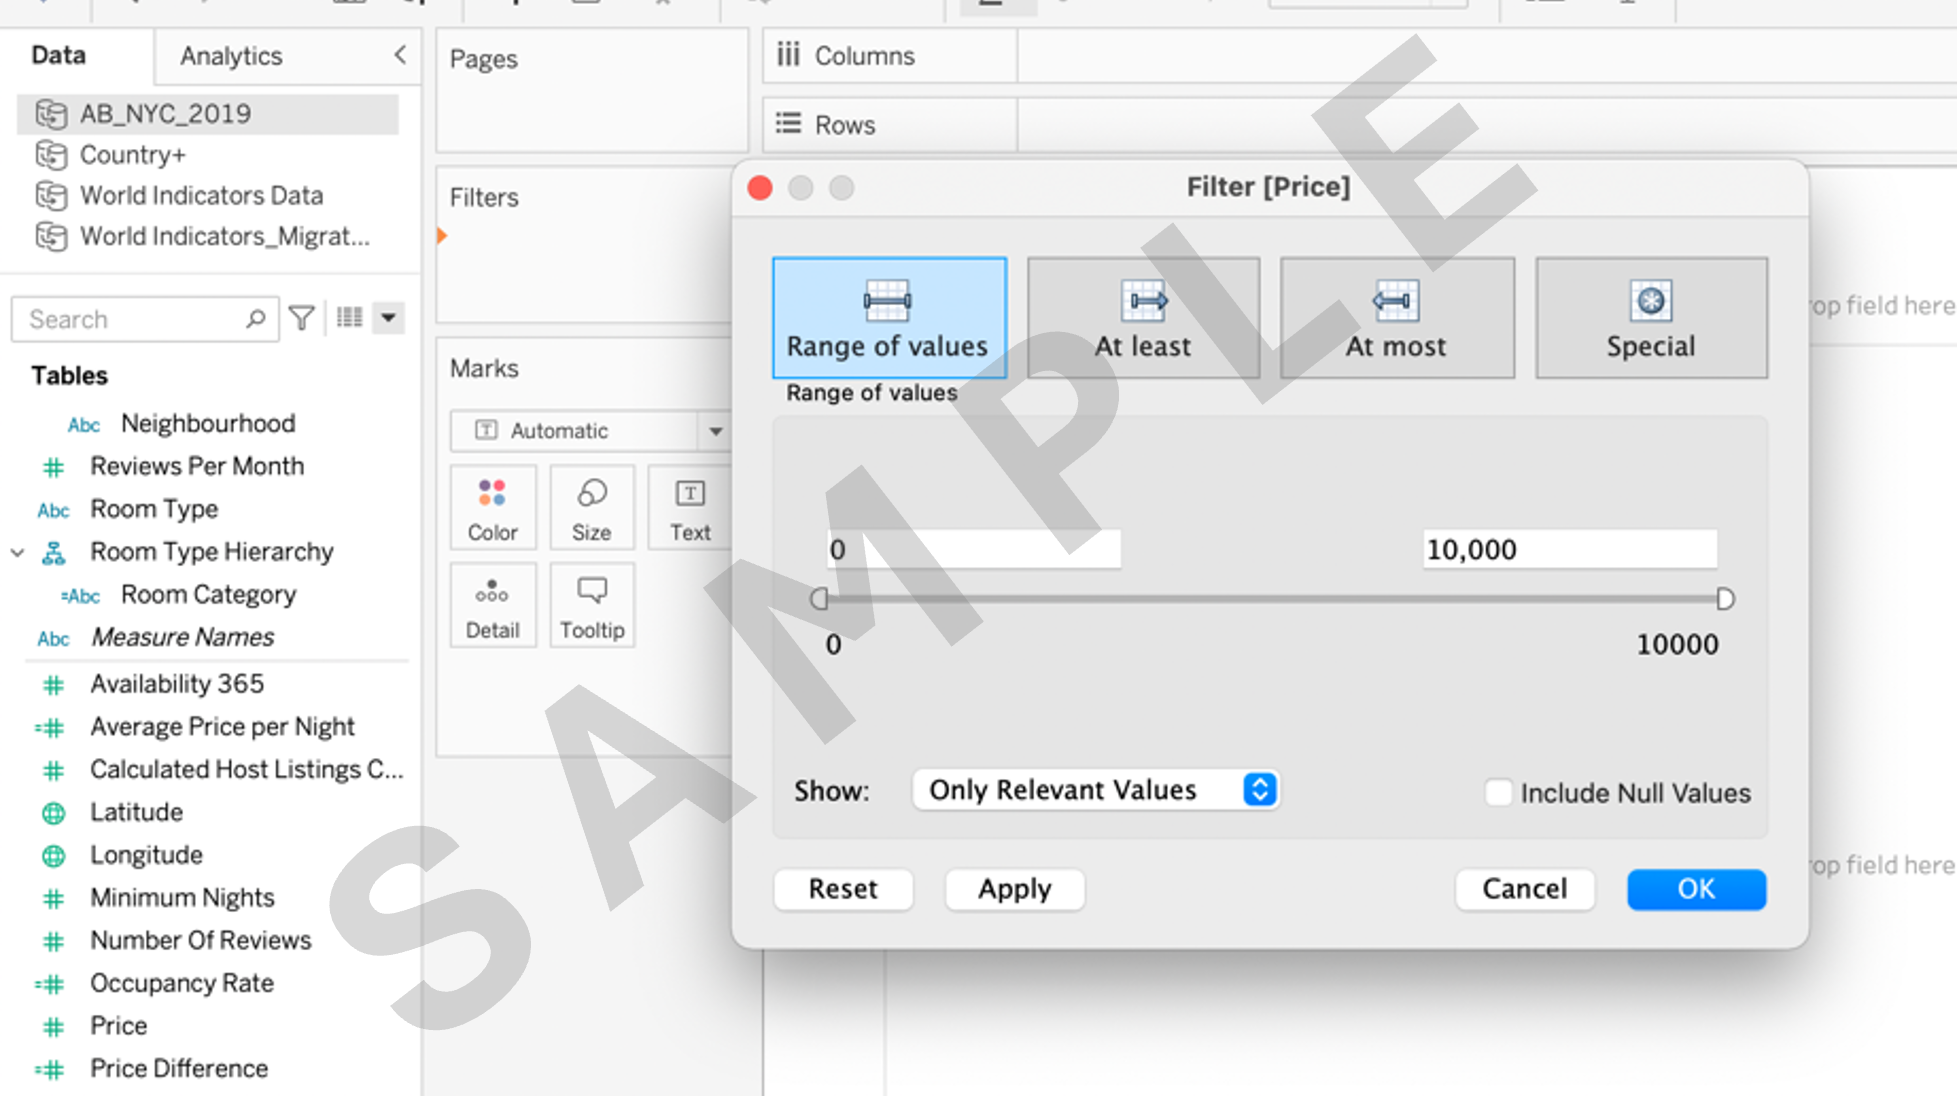
2.1 Filter the fields Price, Occupancy Rate, and Minimum Nights so that you can work non-null values for those fields. You use the Filter shelf for filtering in Tableau Desktop [Public Edition].
2.2 Calculate new fields Average Price per Night by dividing Price by Minimum Nights.

Task 3: Creating basic visualizations
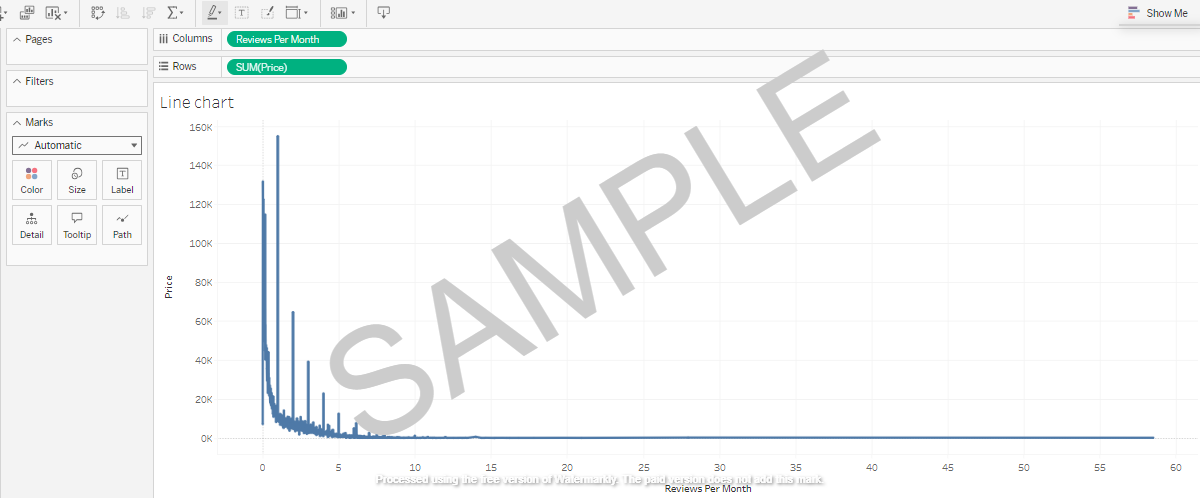
3.1 Create a Line chart to visualize the relationship between Price and Reviews Per Month.
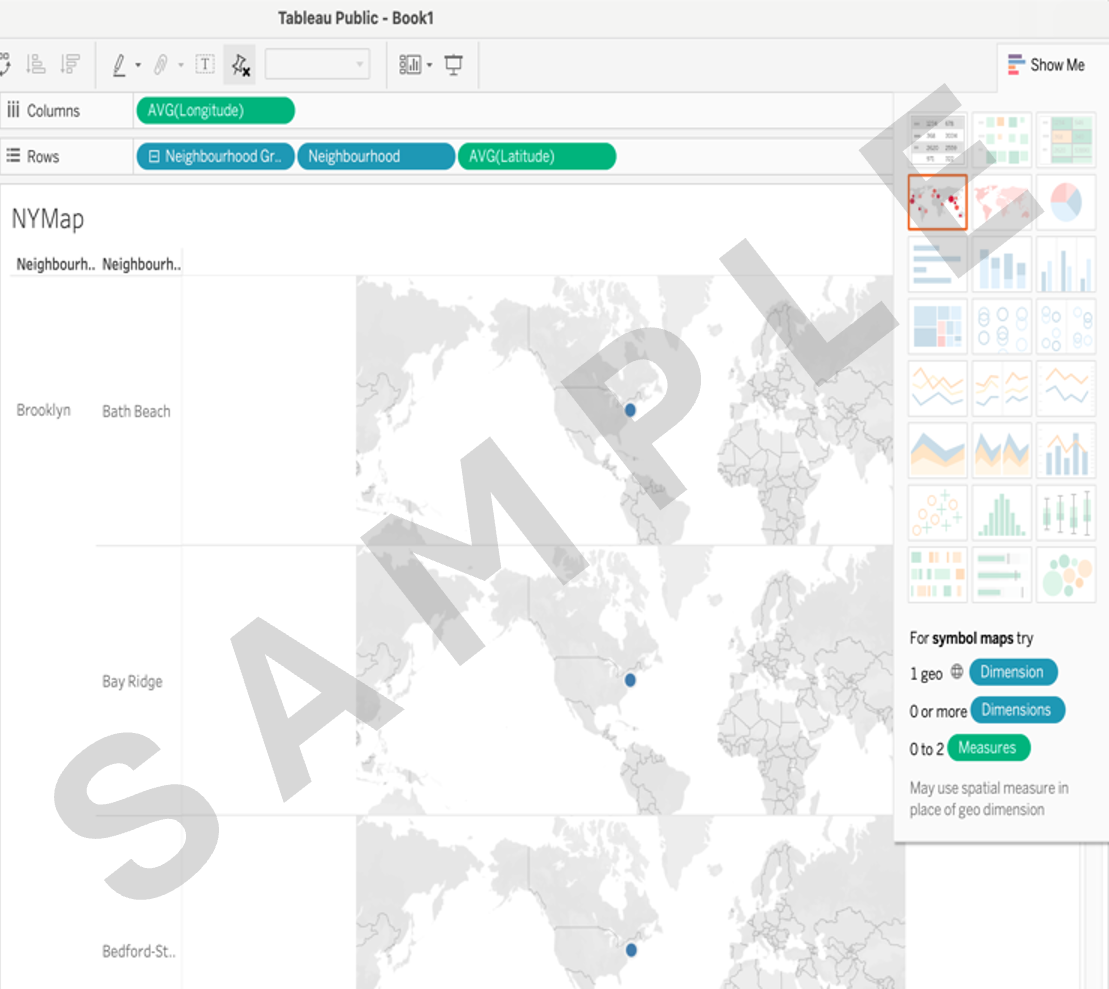
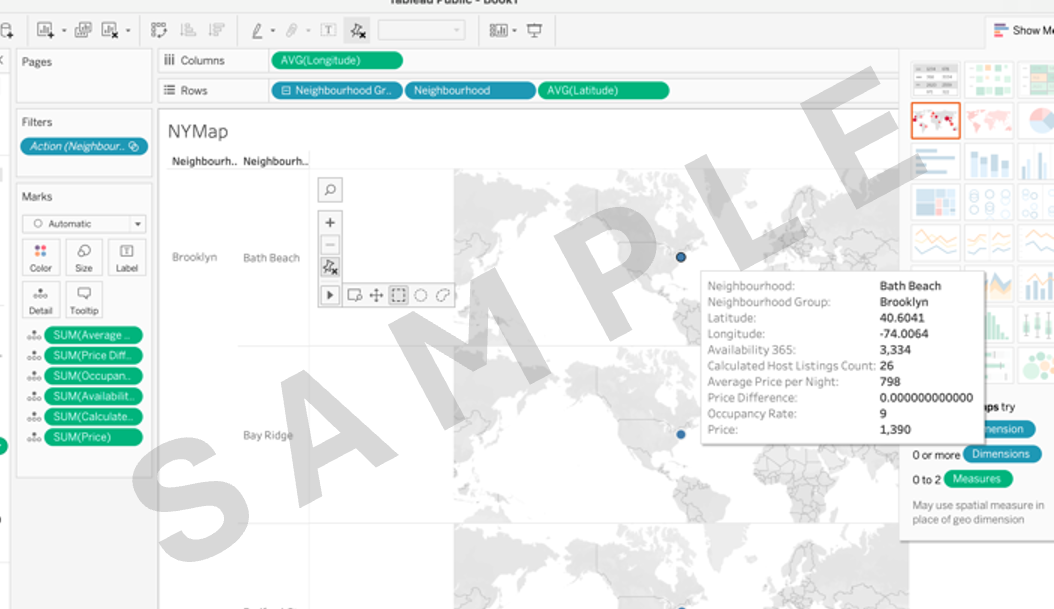
3.2 Create a map using Neighbourhood Group and Neighbourhood.
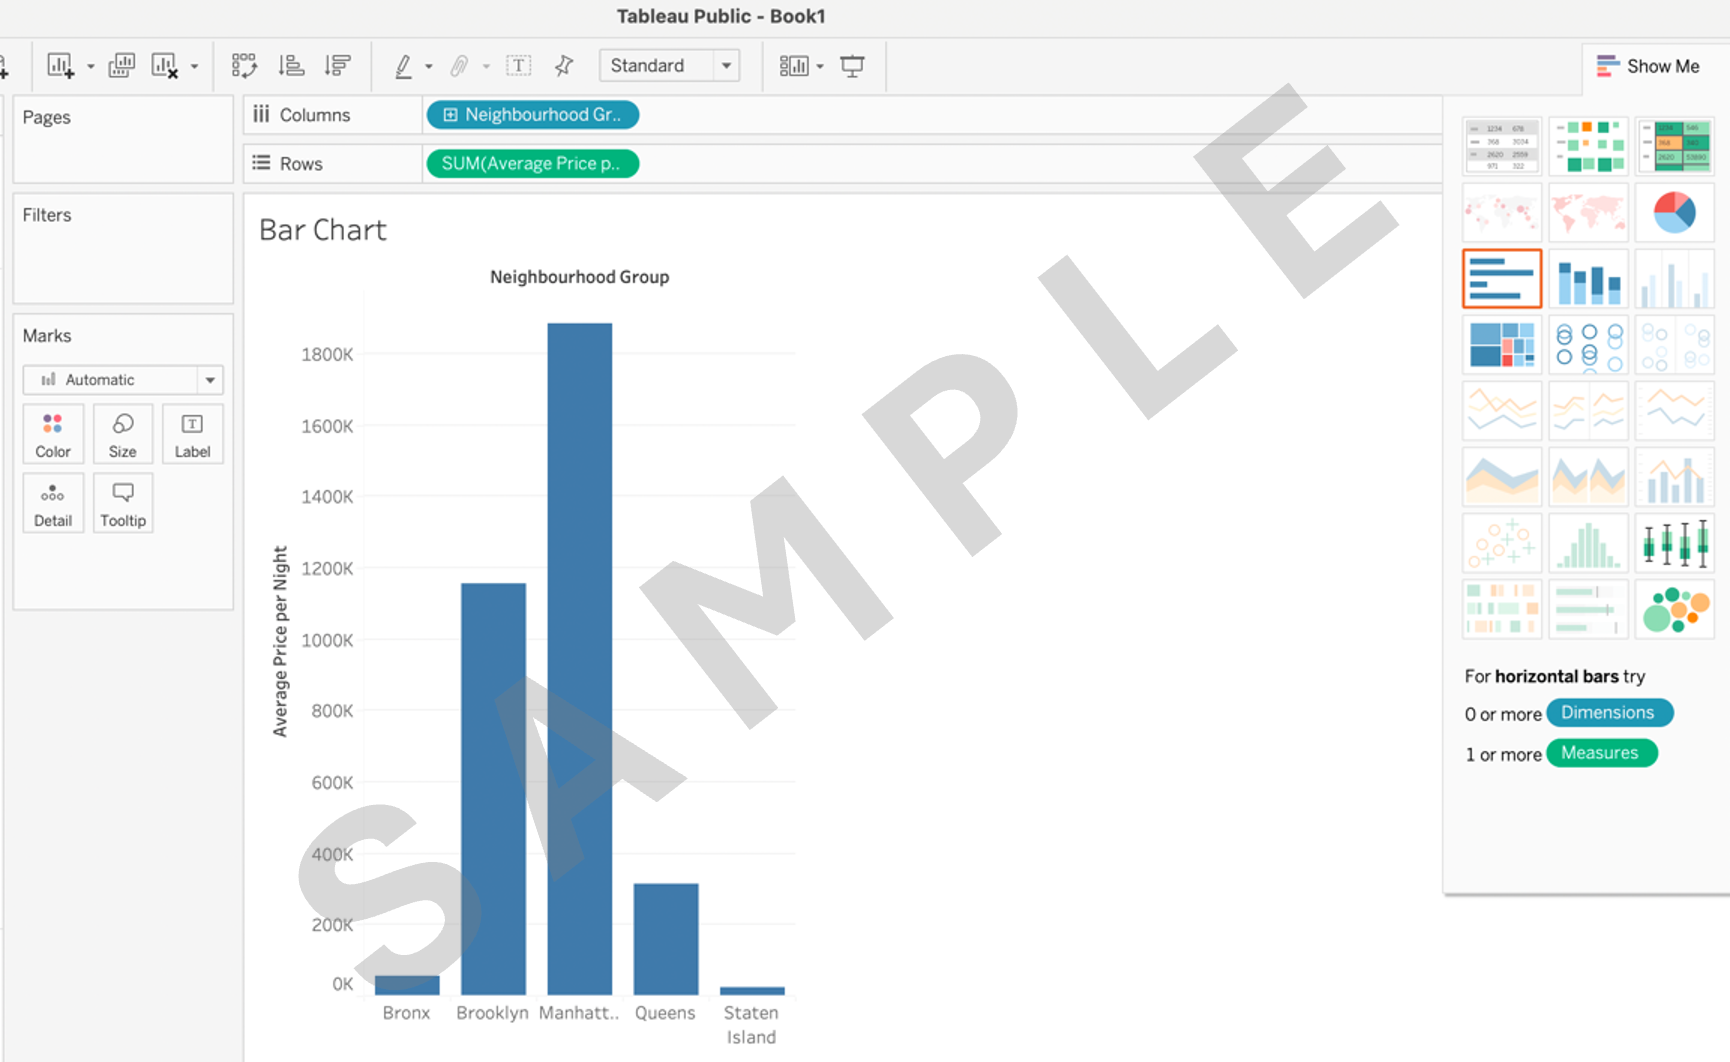
3.3 Create a bar chart to compare the previously created field Average Price per Night across Neighbourhood Group.
Task 4. Creating LOD and complex calculations (by calculated field):
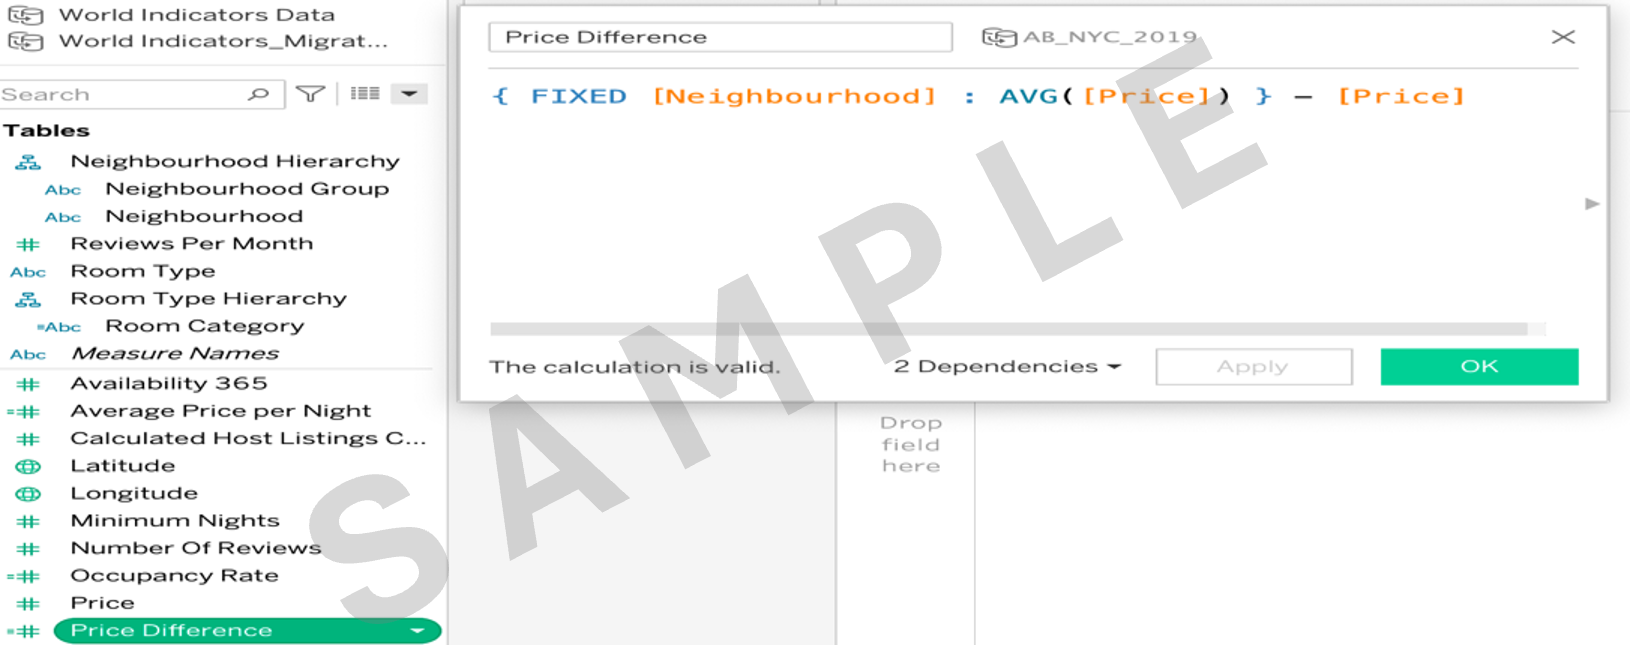
4.1 Create a calculated field named Price Difference using LOD calculations to show the difference between a listing's Price and the average price in its neighborhood.
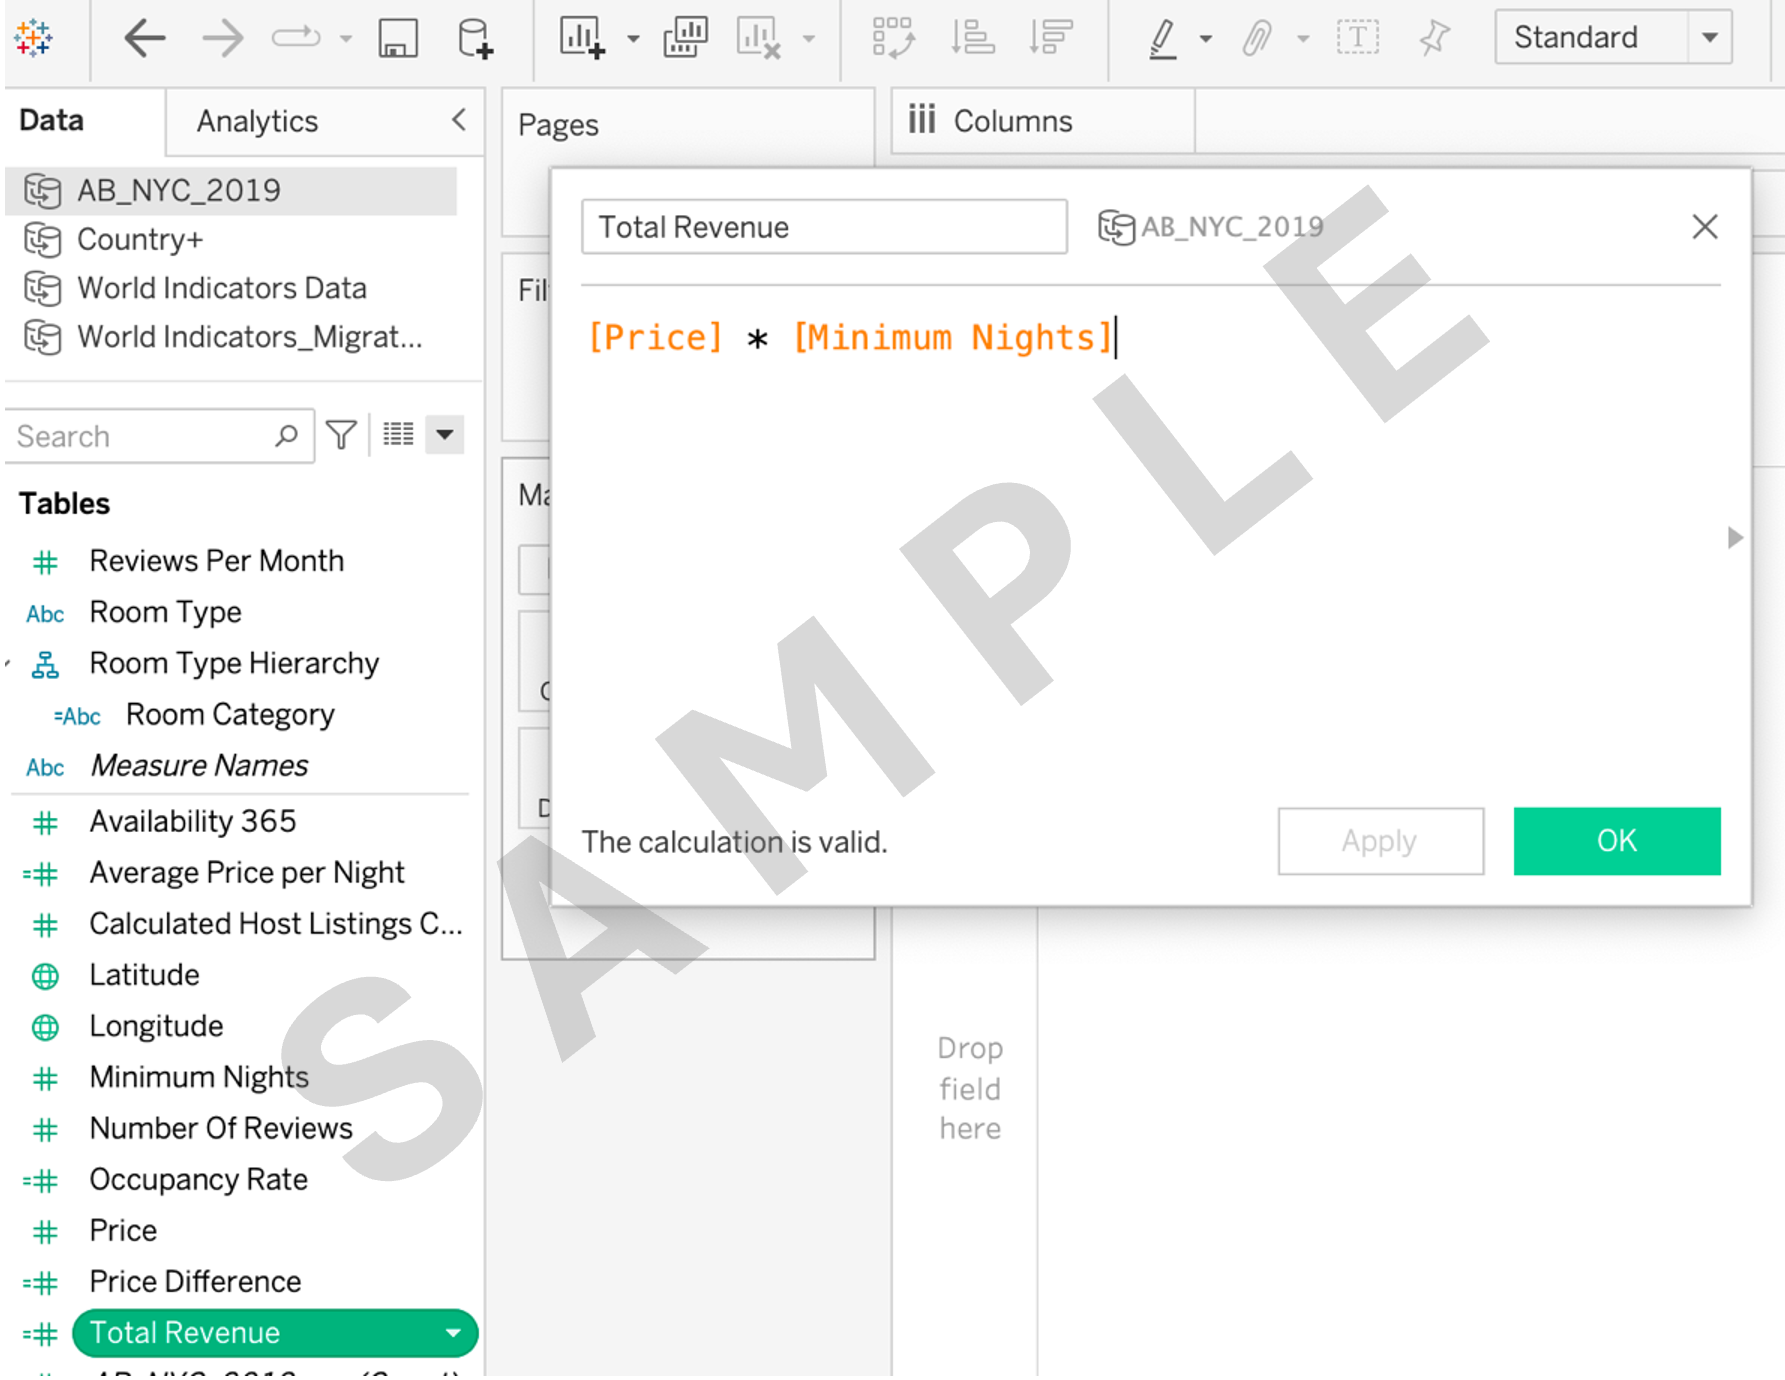
4.2 Create a calculated field named Total Revenue by multiplying Price by Minimum Nights.
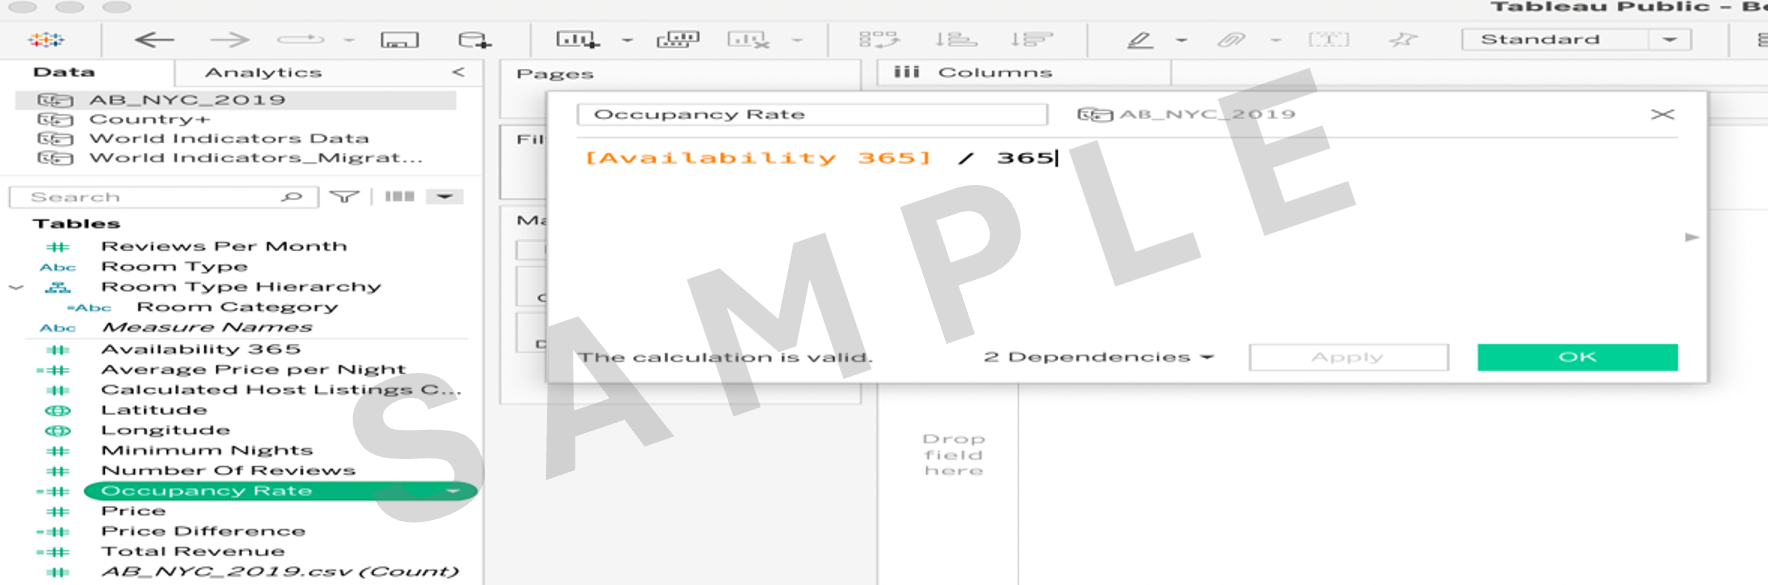
4.3 Create a calculated field named Occupancy Rate by dividing Availability 365 by 365.
Task 5. Using tooltips:
5.1 Enhance your map visualizations by adding tooltips that display additional information on hover, such as Calculated Host Listings Count, Price Difference, Total Revenue, and Occupancy Rate.
Task 6. Creating a final dashboard:
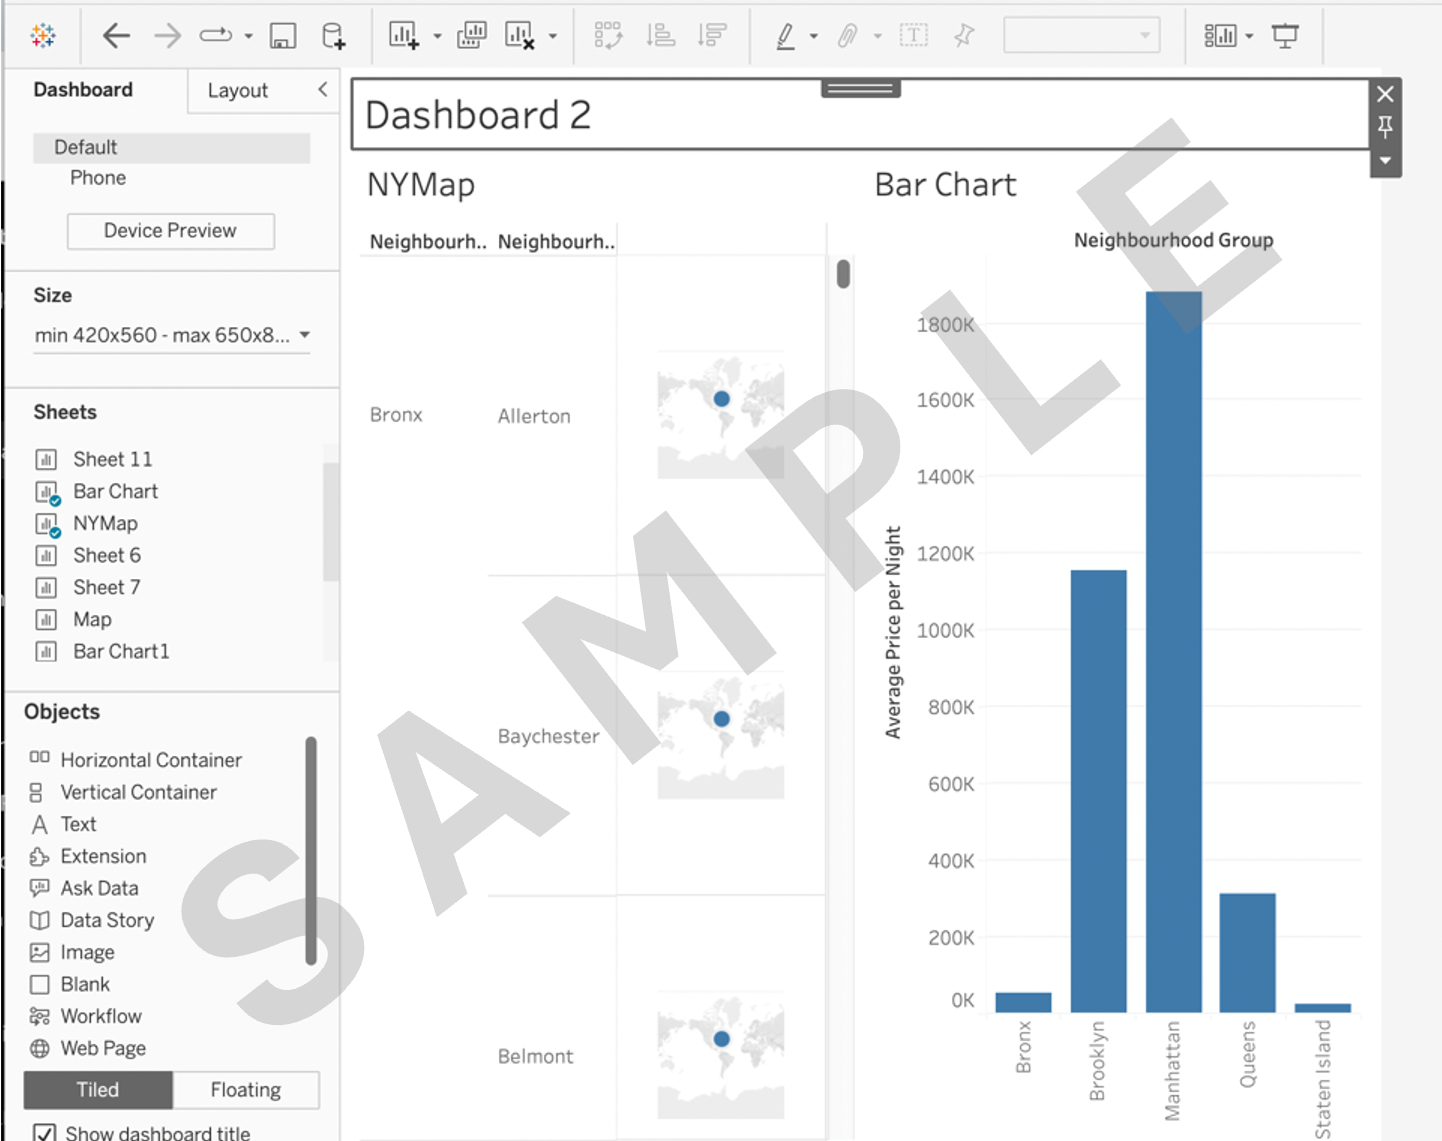
6.1 Create a dashboard and arrange the created visualizations (map and bar chart) and calculated fields into a visually appealing and informative dashboard.
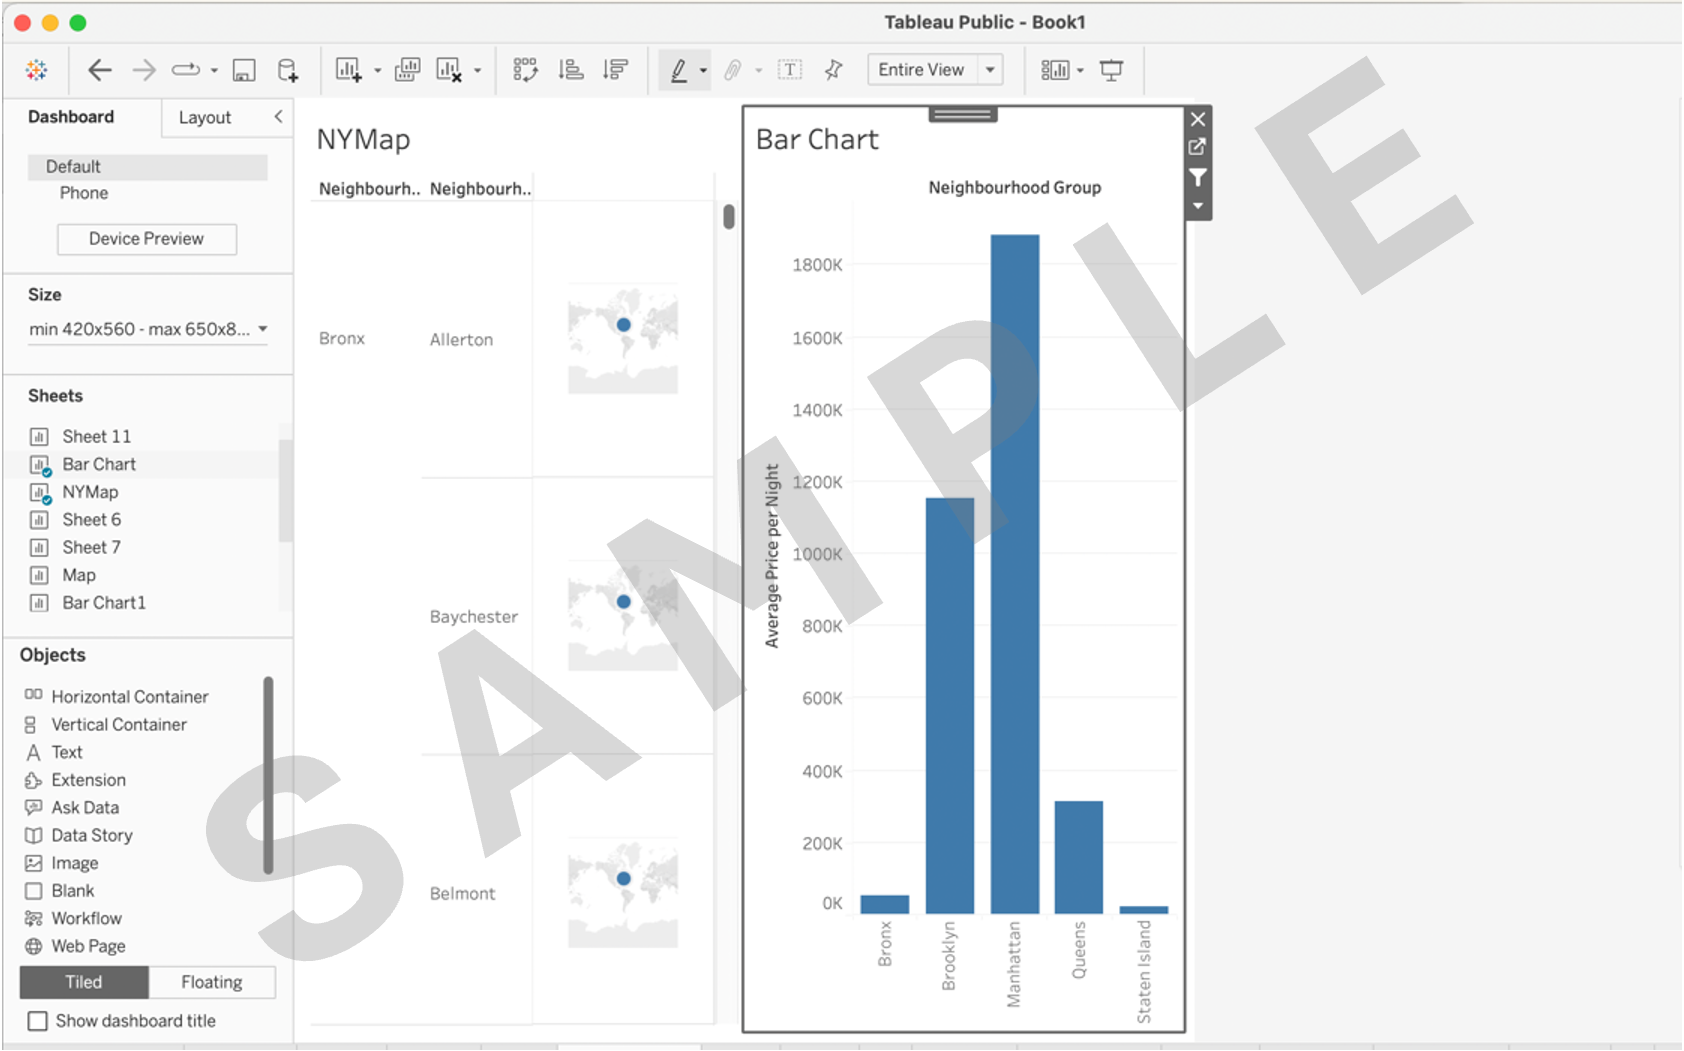
6.2 Use titles, labels, and annotations to guide viewers through the analysis. Titles, labels and annotations are not mentioned as you can show your creativity. As an example, use the appropriate title in place of Dashboard 2.
Task 7. Implementing dashboard actions:
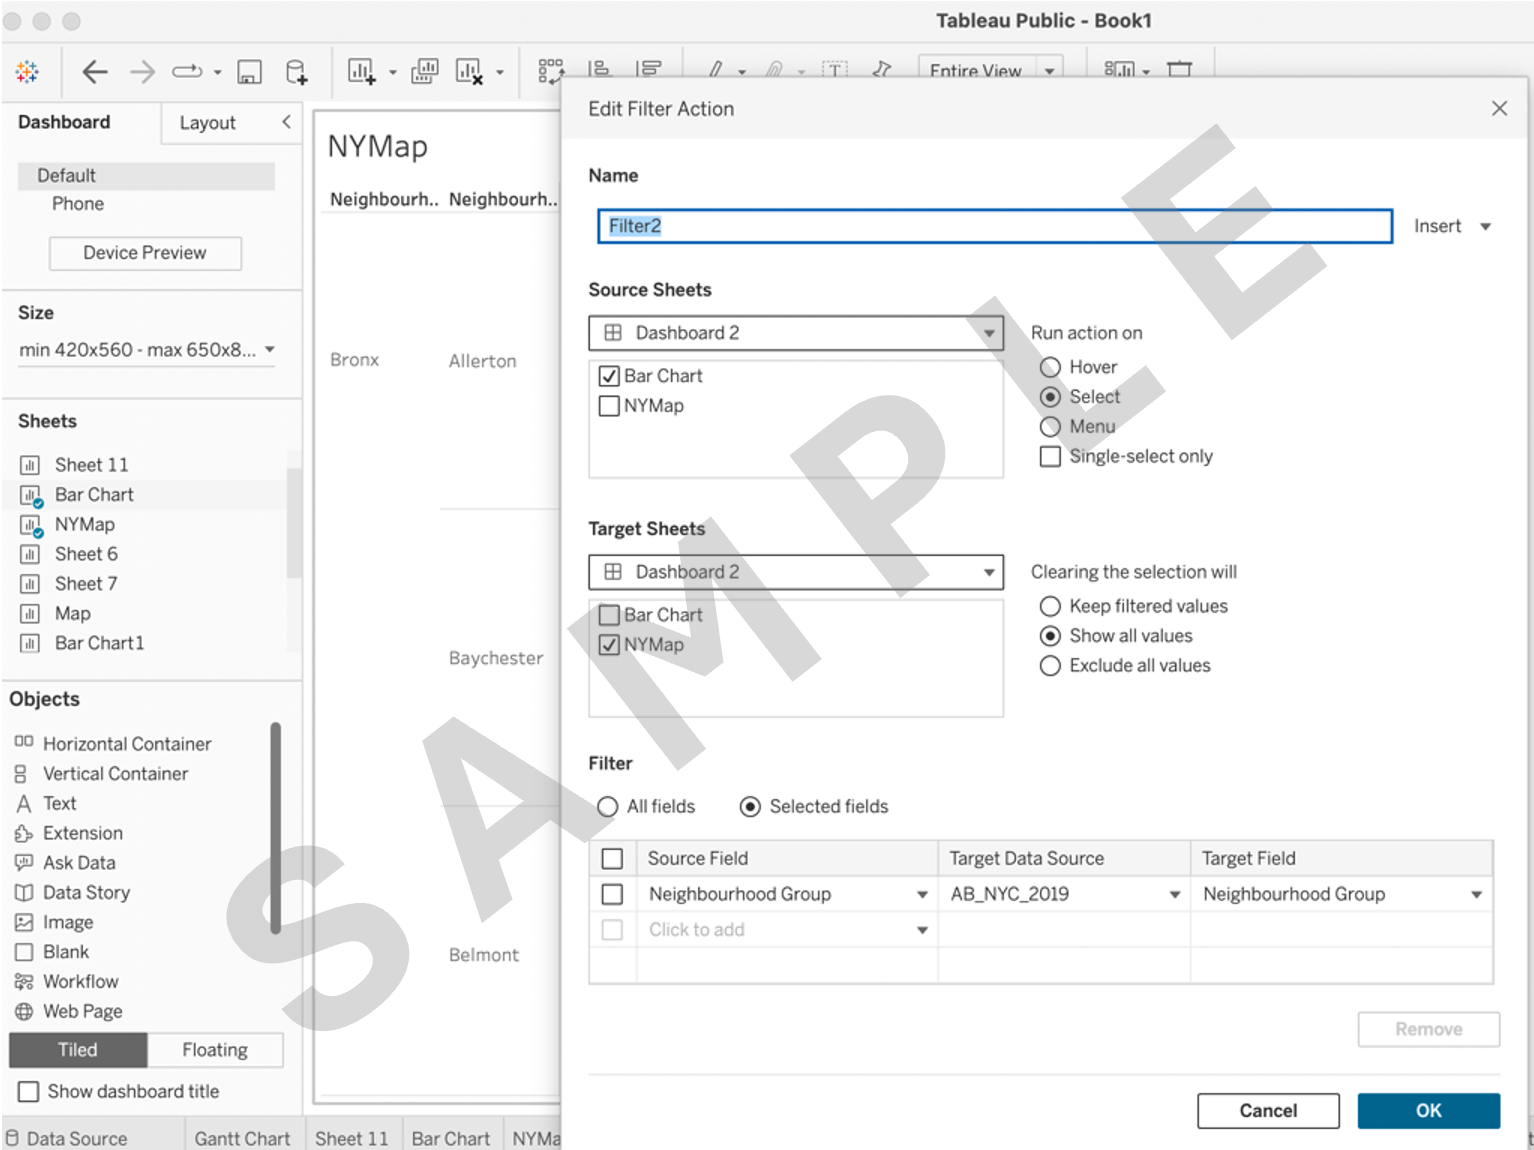
7.1 Create a filter action that allows users to select a specific Neighbourhood Group on the bar chart and see the corresponding price distribution and other details in each neighborhood in the map.
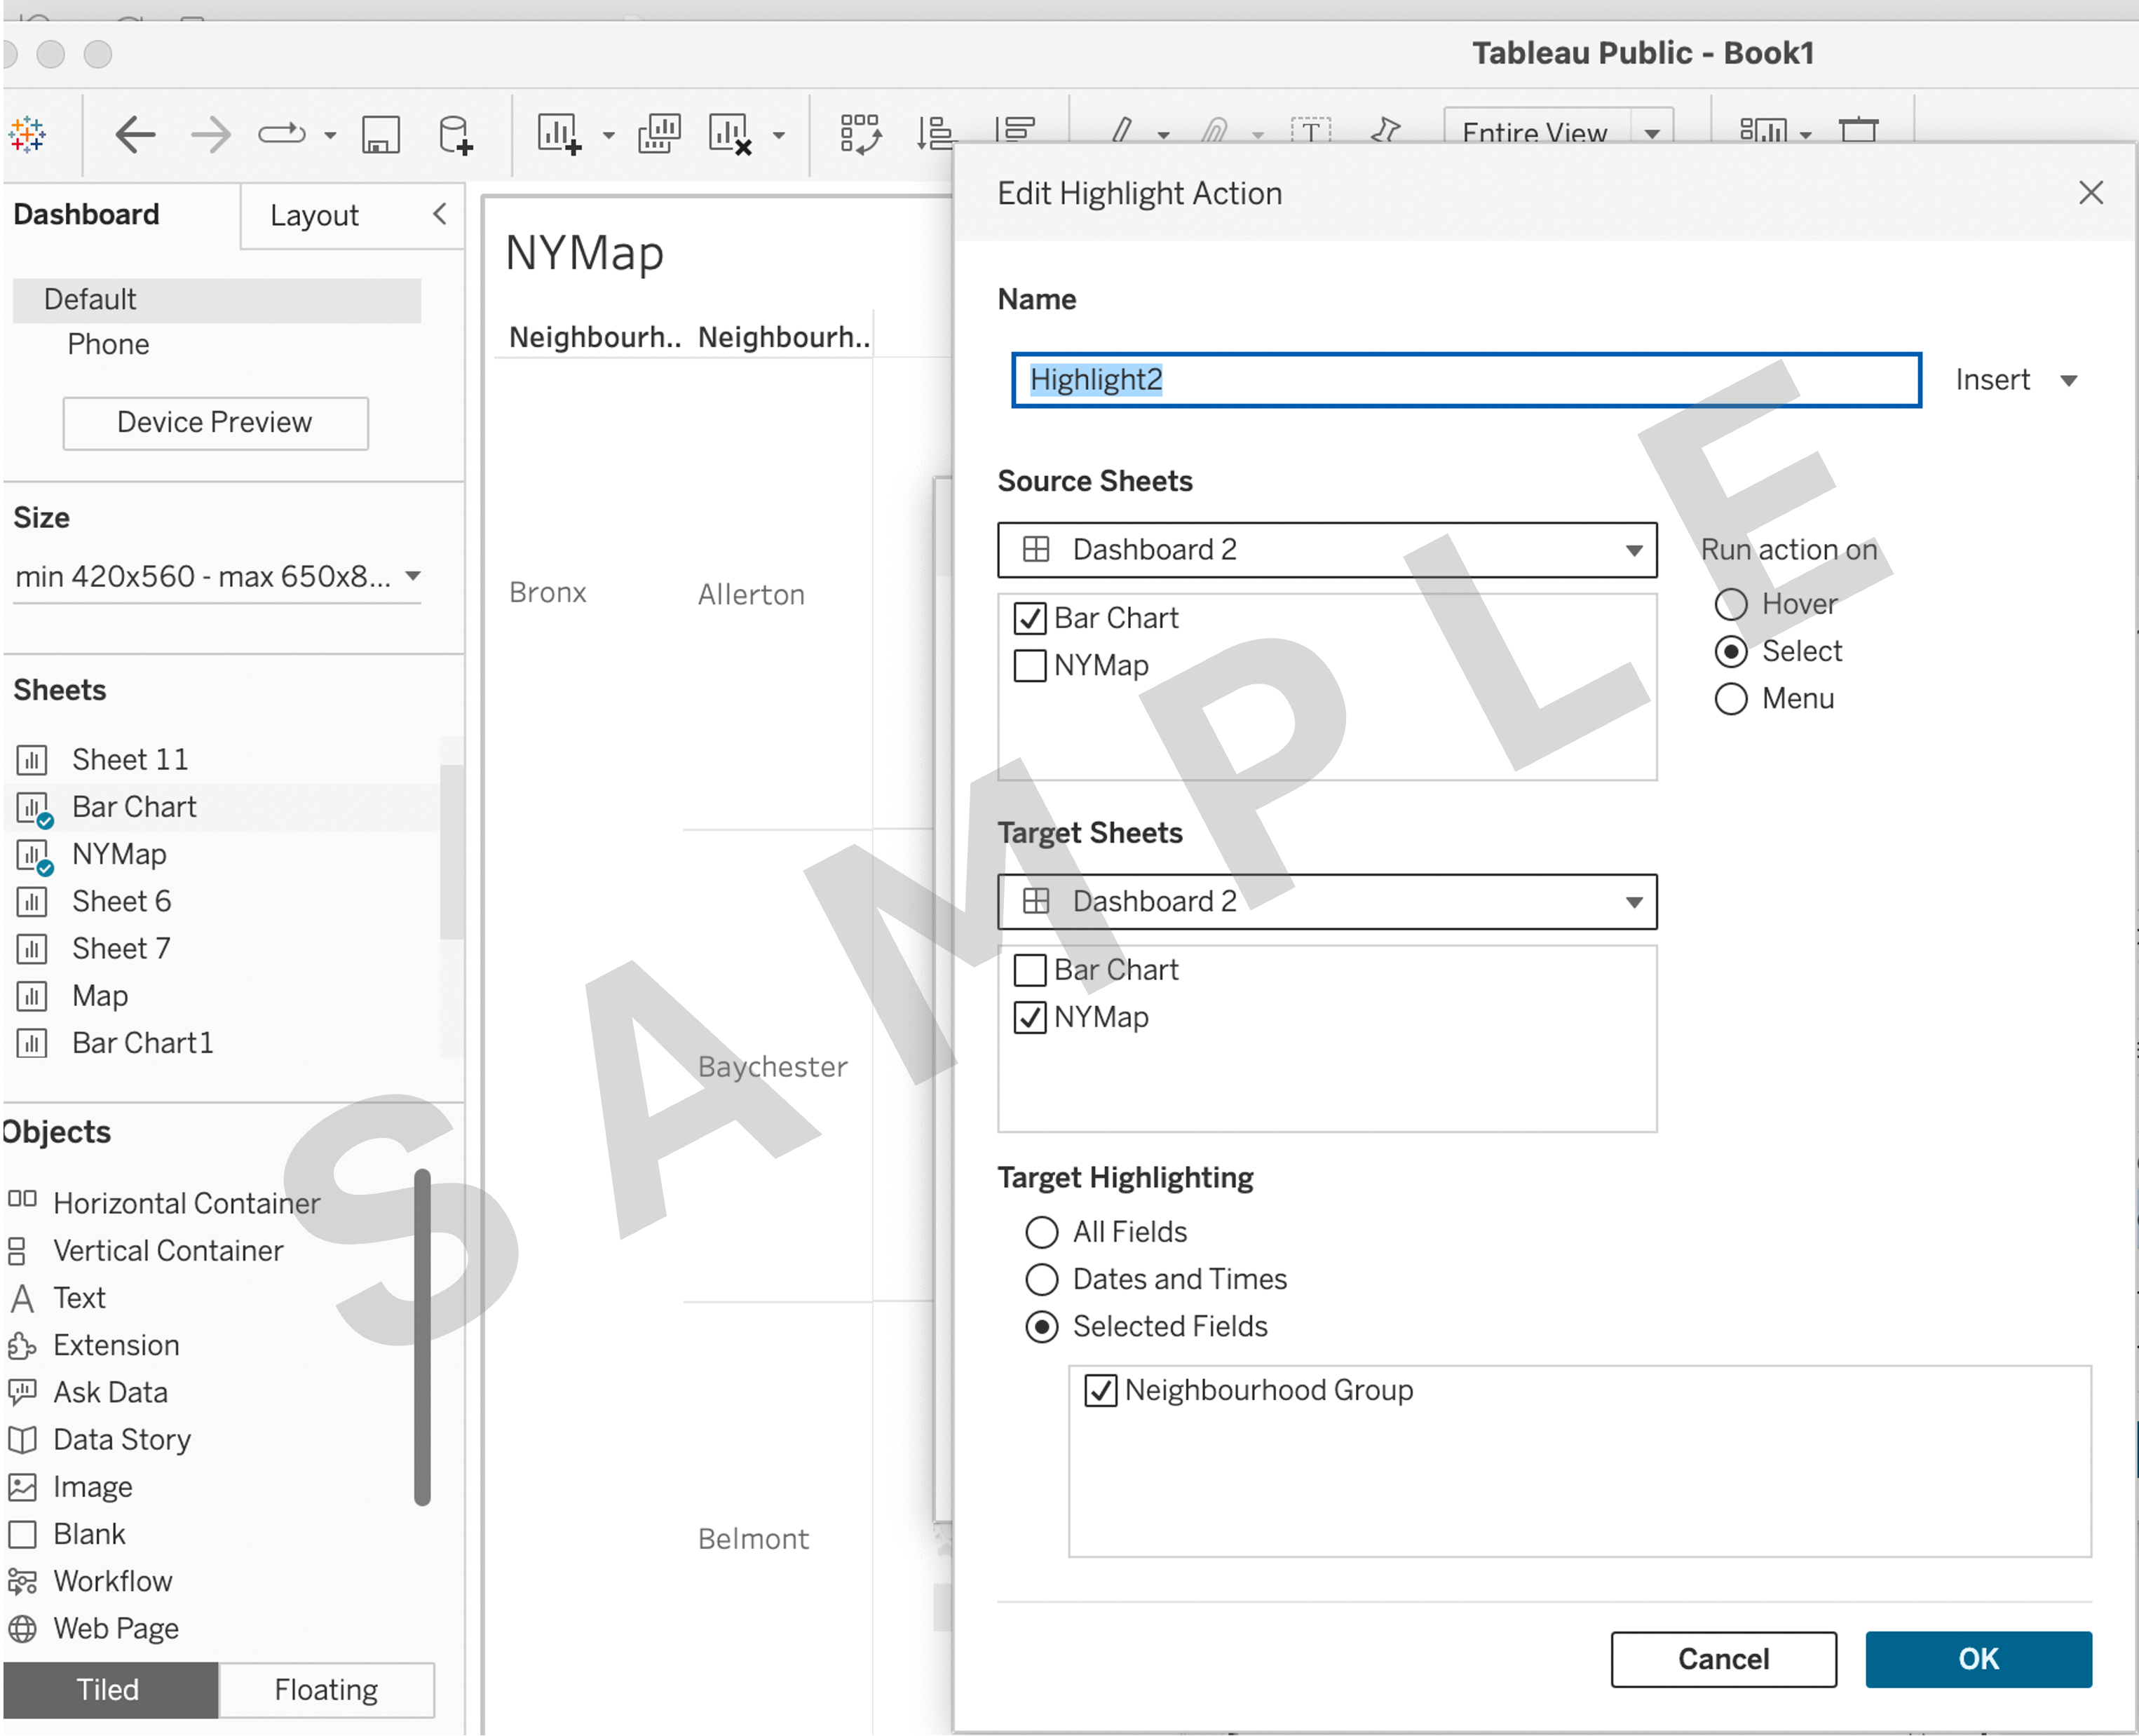
7.2 Implement a highlight action that emphasizes listings of a specific Neighbourhood Group when selected on the bar chart.
Task 8. Project deliverables:
8.1 Publish your final project workbook and copy its link for submission.
To do this:
In the top right corner of the page, click Publish As (or Publish if you've already published the workbook), then click Publish As, name your workbook MyFinalProject(yourname), ensure you check the box Show sheets as tabs, and then click Publish.
In Web Authoring, click File, then click Close.
In the Tableau Public web page for your final project story, click the Share icon in the top right toolbar above the final project workbook, and click Copy Link in the Share dialog box. This will copy the workbook link to the clipboard.